Data-Driven Menu Engineering: Boost Restaurant Profit 10% by 2026
Anúncios
Data-Driven Menu Engineering: Leveraging Analytics for a 10% Profit Margin Improvement in 2026
In the fiercely competitive landscape of the restaurant industry, merely serving great food is no longer enough to guarantee sustained success. Margins are tighter than ever, customer expectations are soaring, and operational costs continue to climb. To thrive, restaurateurs must embrace innovative strategies that go beyond traditional approaches. One such strategy, rapidly gaining traction and proving its worth, is data-driven menu engineering. Imagine a scenario where every dish on your menu isn’t just a culinary creation, but a meticulously calculated component designed to maximize your restaurant’s profitability. This isn’t a pipe dream; it’s the tangible outcome of effectively leveraging analytics in your menu design process.
Anúncios
Our ambitious goal for this article is to lay out a comprehensive roadmap for how your restaurant can achieve a significant 10% profit margin improvement by 2026 through the strategic application of menu engineering analytics. This isn’t about cutting corners or sacrificing quality. Instead, it’s about making smarter, more informed decisions based on concrete data, understanding customer behavior, optimizing pricing, and streamlining operations. By the end of this guide, you will have a clear understanding of the principles, tools, and actionable steps required to transform your menu into a powerful profit-generating engine.
Anúncios
The Evolution of Menu Engineering: From Art to Science
Historically, menu design was often considered an art form, driven by chef creativity, culinary trends, and perhaps a gut feeling about what customers would enjoy. While creativity remains a cornerstone of exceptional dining experiences, the modern era demands a more scientific approach. The concept of menu engineering, as formally introduced by Michael L. Kasavana and Donald J. Smith in the early 1980s, provided the initial framework for categorizing menu items based on their popularity and profitability. This foundational model, while revolutionary for its time, has undergone significant evolution, primarily driven by the advent of advanced data analytics and technology.
Today, menu engineering analytics transforms this traditional framework into a dynamic, ongoing process. It moves beyond static analysis to real-time insights, allowing restaurateurs to adapt quickly to changing market conditions, customer preferences, and supply chain fluctuations. This shift from art to science, or more accurately, from art informed by intuition to art informed by data, is critical for any restaurant aiming for sustainable growth and enhanced profitability.
Why a 10% Profit Margin Improvement is Achievable with Menu Engineering Analytics
A 10% increase in profit margin might sound audacious, but it’s entirely within reach when you systematically apply data-driven menu engineering. Consider the cumulative impact of these optimized areas:
- Optimized Pricing: Data reveals price elasticity for different items, allowing you to fine-tune prices to maximize revenue without deterring customers. Even a small price adjustment on a high-volume item can significantly impact the bottom line.
- Reduced Waste and Inventory Costs: By understanding the true popularity and sales velocity of each item, you can optimize inventory levels, reduce spoilage, and negotiate better deals with suppliers for high-demand ingredients.
- Enhanced Customer Satisfaction: A menu designed with customer preferences in mind leads to higher satisfaction, repeat business, and positive word-of-mouth. Data helps identify what your customers truly value.
- Strategic Item Placement: Understanding how customers navigate your menu allows for strategic placement of high-profit items, drawing attention to them through visual cues and descriptions.
- Improved Operational Efficiency: A streamlined menu with fewer low-performing items can lead to faster kitchen turnaround times, reduced labor costs, and more efficient use of resources.
Each of these elements, when addressed through the lens of menu engineering analytics, contributes incrementally to the overall profit margin, making the 10% target not just achievable, but a realistic benchmark for success.
The Core Components of Data-Driven Menu Engineering
At its heart, menu engineering analytics involves a systematic process of collecting, analyzing, and acting upon data related to your menu items. Let’s break down the key components:
1. Data Collection: The Foundation of Insight
The first step is to gather accurate and comprehensive data. This typically includes:
- Sales Data: Quantity sold for each menu item over specific periods (daily, weekly, monthly, quarterly). This is the most fundamental piece of information.
- Cost Data: The exact cost of ingredients and preparation for each item (Cost of Goods Sold – COGS). This requires meticulous recipe costing.
- Pricing Data: The current selling price of each item.
- Customer Feedback: Surveys, online reviews, social media mentions, and direct feedback about specific dishes.
- Labor Data: Time spent preparing certain dishes, especially complex ones, to understand labor cost implications.
- Inventory Data: Track ingredient usage and waste for each item.
Modern Point-of-Sale (POS) systems are invaluable here, as they can automate much of the sales and inventory tracking. Integrating these with accounting software can further streamline cost data collection.
2. Data Analysis: Unveiling the Menu Engineering Matrix
Once you have the data, the next step is to analyze it to understand the profitability and popularity of each menu item. This is where the classic menu engineering matrix comes into play, but with an analytical upgrade.
Calculating Profitability and Popularity
- Item Profitability: Calculate the contribution margin for each item (Selling Price – COGS). Then, determine the average contribution margin for your entire menu. Items above this average are considered high-profit; those below are low-profit.
- Item Popularity: Calculate the sales mix percentage for each item (Number of units sold for an item / Total number of units sold for all items). Then, establish a benchmark for popularity, typically 70% of the average sales mix percentage for all items in that category. Items above this benchmark are high-popularity; those below are low-popularity.
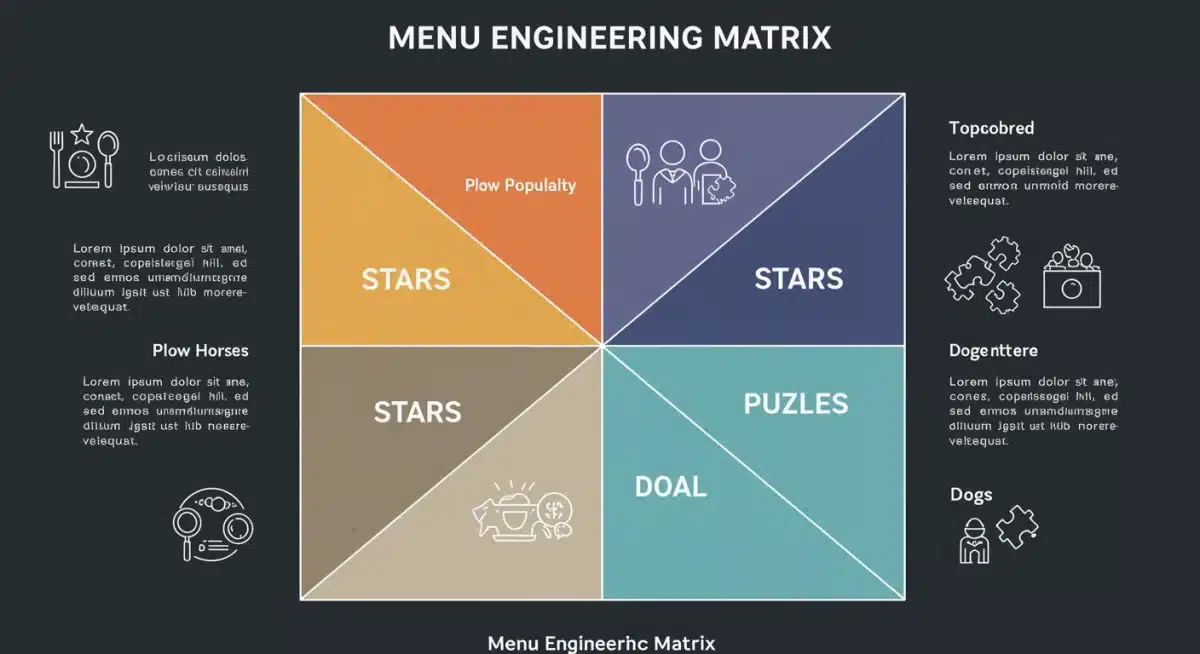
With these two metrics, you can categorize your menu items into four quadrants:


- Stars (High Profit, High Popularity): These are your champions. Customers love them, and they bring in excellent margins. The goal is to maintain their popularity and potentially increase their visibility.
- Plow Horses (Low Profit, High Popularity): Customers order these frequently, but they don’t contribute much to your bottom line. These items need careful attention to boost their profitability without sacrificing popularity.
- Puzzles (High Profit, Low Popularity): These items have great margins but aren’t selling well. They represent untapped potential. The challenge is to increase their appeal and sales volume.
- Dogs (Low Profit, Low Popularity): These are your underperformers. They take up menu space, tie up inventory, and contribute minimally to profits. These are prime candidates for removal or significant re-evaluation.
3. Strategic Action: Turning Insights into Profit
The analysis is only valuable if it leads to actionable strategies. Here’s how to approach each category:
Stars: Nurture and Promote
- Maintain Quality and Consistency: Ensure these items consistently meet high standards.
- Prominent Placement: Feature them prominently on your menu, both visually and verbally. Use enticing descriptions.
- Cross-Selling Opportunities: Pair them with complementary, high-profit side dishes or beverages.
- Slight Price Increase: If demand is consistently high, a small, incremental price increase might be possible without impacting sales volume.
Plow Horses: Boost Profitability
- Portion Control: Can portion sizes be slightly adjusted without affecting perceived value?
- Ingredient Cost Reduction: Explore alternative suppliers or slightly modify ingredients without compromising taste.
- Price Increase: A small price increase for a highly popular item might be accepted by customers. Test it cautiously.
- Bundling: Offer them as part of a higher-priced meal combo with more profitable items.
- Recipe Modification: Can the recipe be tweaked to use less expensive ingredients or reduce prep time?
Puzzles: Increase Popularity
- Enhanced Visibility: Move them to a more prominent section of the menu.
- Descriptive Language: Rewrite menu descriptions to be more appealing and highlight unique selling points.
- Staff Training: Educate your servers to recommend these items enthusiastically.
- Promotions: Offer temporary discounts, specials, or samples to encourage trial.
- Recipe Refinement: Is there something about the dish itself that could be improved to make it more appealing? Consider customer feedback.
Dogs: Re-evaluate or Eliminate
- Recipe Overhaul: Can the item be completely re-imagined to become a Star or Puzzle?
- Ingredient Cost Reduction: Drastically reduce COGS if possible.
- Elimination: If an item consistently underperforms in both popularity and profitability, it’s often best to remove it from the menu to free up resources and simplify operations.
- Seasonal Specials: If it’s a seasonal item, ensure it’s only on the menu when ingredients are fresh and cost-effective.
Advanced Analytics for Deeper Insights
Beyond the basic menu engineering matrix, advanced menu engineering analytics can provide even deeper insights:
Customer Segmentation and Preferences
Not all customers are the same. By segmenting your customer base (e.g., lunch vs. dinner, weekday vs. weekend, families vs. couples), you can tailor menu offerings and promotions. Analytics can reveal which items are popular with specific segments, allowing for more targeted marketing and menu variations.
Predictive Analytics for Demand Forecasting
Leverage historical sales data, seasonal trends, and even external factors like local events or weather patterns to predict future demand for specific dishes. This significantly improves inventory management, reduces waste, and ensures you always have popular items in stock.
A/B Testing Menu Changes
With digital menus and sophisticated POS systems, you can A/B test different menu layouts, descriptions, or pricing strategies in different locations or at different times. This allows you to scientifically determine which changes yield the best results before rolling them out broadly.
Competitive Analysis
Use external data to understand competitor pricing, popular dishes, and customer reviews. While you shouldn’t blindly copy, this intelligence can inform your own pricing strategies and help identify gaps in the market you could fill with profitable items.
Technology and Tools for Menu Engineering Analytics
Implementing a robust data-driven menu engineering strategy requires the right technological infrastructure. Here are some essential tools:
- Modern Point-of-Sale (POS) Systems: These are the backbone. Look for systems with strong reporting capabilities, inventory management integration, and customer relationship management (CRM) features. Examples include Toast, Square for Restaurants, Clover, and Lightspeed.
- Inventory Management Software: Crucial for accurate COGS calculations and waste reduction. Many POS systems include this, but dedicated solutions like BevSpot or Compeat offer more advanced features.
- Recipe Costing Software: Essential for precise cost analysis of each dish. This can be a standalone tool or integrated into inventory management/POS.
- Business Intelligence (BI) Dashboards: Tools like Tableau, Power BI, or even advanced Excel dashboards can visualize your menu data, making trends and insights easier to spot. Some POS systems offer built-in BI tools.
- Online Ordering and Delivery Platforms: Integrate data from these platforms into your overall analysis, as they often represent a significant portion of sales and can have different customer preferences.
- Customer Feedback Platforms: Tools for managing online reviews (Yelp, Google, TripAdvisor) and conducting internal surveys.
The key is to ensure these systems can communicate and share data, creating a unified view of your restaurant’s performance. Cloud-based solutions often facilitate this integration more easily.

Implementing Your Data-Driven Menu Engineering Strategy: A Step-by-Step Guide
Achieving a 10% profit margin improvement by 2026 with menu engineering analytics requires a structured approach. Here’s a practical roadmap:
Step 1: Audit Your Current State (Q4 2023 – Q1 2024)
- Data Infrastructure Assessment: Evaluate your current POS system and other software. Identify gaps in data collection and reporting.
- Recipe Costing Accuracy: Conduct a thorough audit of all your recipes to ensure COGS are precise and up-to-date. Account for waste and portioning.
- Initial Menu Analysis: Perform a baseline menu engineering analysis using available data. Identify your initial Stars, Plow Horses, Puzzles, and Dogs.
- Set Clear KPIs: Define specific Key Performance Indicators beyond just profit margin, such as average check size, food cost percentage, table turnover, and customer satisfaction scores.
Step 2: Invest in Technology and Training (Q1 – Q2 2024)
- Upgrade Systems: Invest in or optimize your POS and inventory management systems to ensure robust data collection and reporting.
- Staff Training: Train your kitchen staff on consistent portion control and recipe adherence. Train front-of-house staff on menu knowledge and upselling techniques for high-profit items.
- Data Literacy: Educate management on how to interpret and act on menu engineering reports.
Step 3: Implement Initial Menu Adjustments (Q2 – Q3 2024)
- Target Dogs: Begin by addressing your ‘Dog’ items. Can any be salvaged with significant changes? Or is it time to remove them?
- Optimize Plow Horses: Implement small, strategic changes to portion sizes, ingredient sourcing, or pricing for ‘Plow Horse’ items.
- Promote Puzzles: Focus on marketing and suggestive selling for ‘Puzzle’ items. Experiment with menu descriptions and placement.
- Enhance Stars: Reinforce the quality and visibility of your ‘Stars.’
- Monitor Immediately: Track the impact of every change using your analytics tools.
Step 4: Continuous Analysis and Iteration (Q4 2024 – Q4 2026)
- Regular Reviews: Schedule monthly or quarterly menu engineering reviews. This is not a one-time project but an ongoing process.
- Seasonal Adjustments: Factor in seasonality for ingredients and customer preferences.
- Customer Feedback Loop: Continuously collect and integrate customer feedback into your menu decisions.
- A/B Testing: Systematically test new menu items, pricing, and descriptions.
- Competitive Benchmarking: Keep an eye on what competitors are doing and how it impacts your menu’s performance.
- Goal Tracking: Regularly measure your KPIs against your 10% profit margin improvement goal. Adjust strategies as needed.
Common Pitfalls to Avoid
While the benefits of menu engineering analytics are clear, several common mistakes can derail your efforts:
- Inaccurate Data: Garbage in, garbage out. If your COGS are estimates or your sales data is incomplete, your analysis will be flawed.
- Ignoring Customer Feedback: Data isn’t just numbers. Qualitative feedback provides crucial context to quantitative insights.
- Fear of Change: Hesitation to remove beloved but unprofitable items can hinder overall profit growth.
- One-Time Analysis: Menu engineering is an ongoing process. Customer tastes, ingredient costs, and market conditions constantly change.
- Over-Complication: Don’t try to analyze every single variable at once. Start with the core metrics and expand as you gain confidence.
- Neglecting Staff Training: Your front-line staff are critical in executing menu strategy, from suggestive selling to communicating changes.
The Future of Restaurant Profitability: A Data-Driven Approach
The restaurant industry is dynamic, and only those who adapt and innovate will truly succeed. By embracing data-driven menu engineering, you’re not just optimizing your menu; you’re fundamentally transforming your business model to be more resilient, efficient, and profitable. The 10% profit margin improvement by 2026 is an ambitious but entirely attainable goal that represents a significant competitive advantage.
Think of your menu not just as a list of dishes, but as a strategic asset. Every item, every price point, and every description can be optimized to contribute maximally to your restaurant’s financial health. This level of precision and insight was once the exclusive domain of large corporations, but with today’s accessible technology, it’s within reach for independent restaurants and small chains alike.
Start your journey today. Begin by gathering your data, getting comfortable with the analytics, and making those first strategic adjustments. The continuous cycle of analysis, action, and monitoring will not only lead to a healthier bottom line but also a deeper understanding of your customers and your business. The future of restaurant profitability is data-driven, and the time to act is now.


